
It’s no secret that vinyl has made an impressive comeback within the last decade. Whether you think it’s a fad or a passing trend, that doesn’t negate the reality that more and more vinyl records are being produced and purchased across the entire globe.
So how did vinyl make its comeback?
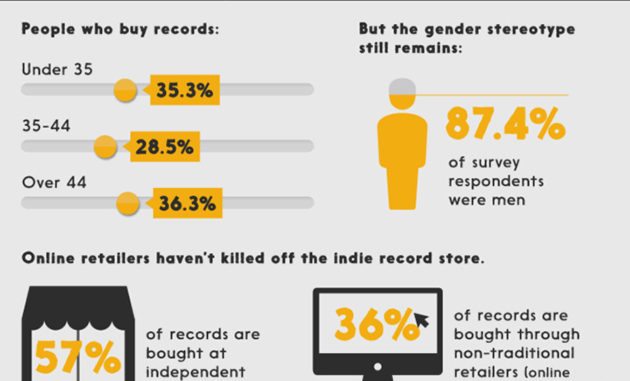
Fortunately for you, the reader, you don’t have to sit here and listen to me pine for all things wax; the fine folks at Liberty Games and NeoMam Studios have put together an extensive infographic (below) that tracks vinyl’s rise, who is buying records, where they’re buying records and why.
For instance, in the United States, vinyl sales increased by 52 percent from 2013 to 2014. But it’s not just stateside; the same success is found in the U.K. (1.3 million units were moved in 2014 compared to under 1 million in 2013) and Australia (an increase of 127 percent year-over-year).
The infographic admits the reason for this comeback isn’t “cost and convenience,” but rather ownership, nostalgia, interaction and sound — something fans of the format have long known.
There’s also a clear understanding of what the future holds for the record industry, and that physical LPs won’t save it; but what is happening is we are seeing an increase of brick-and-mortar stores selling music, more now than ever before.
And obviously, one of the biggest nods vinyl can give to its comeback is recognizing the international impact of Record Store Day, which kicked off in 2008 and has grown into a massive celebration (one that’s easy, but wrong, to pick on).
So, as the needle drops on your favorite record today, take a few minutes and check out the comprehensive infographic below — and let’s all celebrate the comeback of vinyl.
Via Diffuser FM


Be the first to comment